
Before a client even asks, a good market analysis has already answered the one question on their mind: is now the time to buy, sell, or hold right here? Most agents answer that with a gut feeling. The ones who keep winning listings answer with numbers, and they show their work.
Researching a market from scratch is a repeatable process, and it holds at any scale, single zip code or whole metro. The hard part is knowing which data sources deserve your time, which frameworks turn a pile of raw numbers into a story, and whether the signal you are staring at is leading or lagging.
We have spent 10+ years working only in real estate and supported more than $500M in development sales. Everything below comes out of real deals. Not theory. By the end you should have a repeatable process. Run it on Naples, on Nashville, on a six-block stretch of Brickell.
You will also walk away with a report template you can hand a client without rewriting the whole thing every time.
What Is a Real Estate Market Analysis?
Think of a real estate market analysis as the disciplined way you size up supply, demand, pricing, and timing inside a defined area, so you can tell a client whether to buy, sell, or hold and what number to put on it. The inputs are hard ones.
Active listings, closed sales, days on market, absorption rate, all pulled at one consistent geography and one time window, then read together as a single story rather than a scatter of facts. What makes the method useful is that it scales.
- Aim it at one property and you have a comparative market analysis.
- Aim it at a neighborhood and you have a listing decision.
- Aim it at an office, retail, or multifamily asset and you are running a commercial real estate market analysis, where rent rolls and cap rates join the mix.
The data points shift with the asset class. The discipline stays the same.
Why Most Market Analysis Falls Apart
Mixing scales is the usual culprit. An agent quotes a national headline about rates, then a state-level price trend, then turns around and tells a buyer what their street is doing. All in one breath. Those three numbers can point in completely opposite directions at the same moment.
A real estate market analysis only holds up when every number describes the same geography and the same time window. National inventory can tighten while one suburb floods with new construction. So the fix is just discipline.
Pick your geography, pick your time window, pull every metric at that level, and only then open your mouth. Recency bias is the second trap. One hot weekend of showings feels like a trend. It isn’t. Real trends live in three to six months of data, not in last Saturday.
The Data Sources That Actually Matter
A paid terminal is not what separates a strong analysis from a weak one. Knowing which source answers which question is. Real estate market analysis tools and software help with the pulls and the charts, sure, but the sources below are where the real numbers live. Most of them cost nothing.
MLS Data
Start with the MLS. It is your primary engine, and it tells you what is listed, what sold, at what price, and how fast it moved. For your target geography, pull active listings, new listings in the period, pending sales, closed sales, the sale-to-list price ratio, and days on market. One habit that catches people out: sort sold comps by close date, never list date. A property that listed in January and closed in April is telling you about winter pricing, not spring demand. Plenty of agents miss that and end up quoting comps that are three months stale.
Public Records
Where the MLS goes quiet, county property records fill in the gaps. They confirm square footage, lot size, ownership history, tax assessed value, and whether a sale was actually arm’s length. That last one matters more than people think. A suspiciously low comp often turns out to be a family transfer or a distressed sale, and two minutes in the records will tell you which. Investors get an extra read here. Records show how long current owners have held. A street where most owners bought more than ten years ago behaves nothing like one packed with 2022 buyers sitting on thin equity.
Census and Economic Indicators
Demand has a ceiling, and population, household formation, median income, and job growth are what set it. No market holds rising prices for long unless people and paychecks keep moving in behind them. You can get all of this free from the Census Bureau and the Bureau of Labor Statistics, at both the metro and county level. Of the bunch, job growth is the one to watch. Homes follow jobs. Let one big employer announce an expansion and you can usually call the demand pressure in the surrounding zip codes six to twelve months ahead.
Mortgage Rate Data
Rates set affordability, and affordability sets the size of the buyer pool. Track the weekly average 30-year fixed, then do the more useful thing and convert it into the monthly payment at your market’s median price. Nobody feels a rate. They feel a payment. Here is the math that makes the point. On a $500,000 price with 20% down, the gap between a 6.0% and a 7.0% rate runs about $250 a month. That swing quietly prices a real slice of buyers out of the running, and it lands in your absorption numbers a month or two down the line.
Days on Market, Absorption Rate, and Months of Inventory
Take these three together and a pile of listings turns into a read on momentum. Days on market is the median time from list to contract. When it climbs, demand is cooling or the pricing is too rich. Simple as that. Absorption rate is the pace at which available homes sell. Divide closed sales in a period by active listings, then put it as a percentage. Forty homes sold last month against 200 active listings? That is a 20% monthly absorption rate. Months of inventory tells you how long it would take to sell everything currently listed at the current sales pace. Divide active listings by the number of homes selling per month. With 200 actives and 40 monthly sales, you have 5 months of inventory. Under 4 to 5 months favors sellers. Above 6 months favors buyers. Around 5 to 6 months is roughly balanced.
Frameworks That Turn Numbers Into a Story
Data alone does not persuade. A framework does.
Supply and Demand
Every market read starts here. Supply is your active listings, new construction pipeline, and months of inventory. Demand is showing activity, pending sales, mortgage applications, and the absorption rate. Lay them side by side. Falling inventory plus rising absorption means prices have room to climb. Rising inventory plus falling absorption means the opposite. The interesting cases are mixed signals, and that is where you earn your fee by explaining which force is winning.
Comparative Market Analysis (CMA)
A comparative market analysis (CMA) is the same market analysis, just aimed at one property. You gather recent sold comps, the active competition, and the expired or withdrawn listings, then adjust for differences in size, condition, location, and features. Three rules keep a CMA honest. Use comps closed within the last 90 days. Stay inside the same school zone, ideally the same subdivision. And always adjust toward the subject property, never away from it. Comp has a pool and your subject doesn’t? Subtract the pool’s value from the comp. Expired listings are the most underused part of a CMA. They tell you the ceiling. If three homes priced above $1.2M sat for 180 days and expired, that price is where buyer demand stops, no matter what a hopeful seller wants.
Neighborhood-Level Versus Metro-Level
Metro data sets the backdrop. Neighborhood data closes the deal. A metro can post 5% annual appreciation while one neighborhood inside it runs flat and another jumps 12%. Always run both. Lead a client conversation with the metro picture for context, then zoom to their specific area for the decision. The gap between the two is often your most valuable insight. When a strong neighborhood sits inside a soft metro, that is a buy signal most people miss because they stopped at the headline. In Miami luxury the gap gets extreme. Two waterfront buildings a quarter mile apart, say one in Brickell and one across in Coral Gables, can run completely different price-per-square-foot trends thanks to views, line, and floor. A metro average is useless at that resolution. We have run this enough times in our own market to stop quoting anyone a citywide number for a building-specific decision.
Leading Versus Lagging Indicators
This is the difference between predicting a market and reporting on one. Most agents only do the second.
Lagging Indicators
Lagging indicators confirm what already happened. Closed sale prices, closed sales volume, and appraised values all describe deals that started weeks or months earlier. They are accurate and they are old. Use them to establish where the market has been, never to forecast where it is going.
Leading Indicators
Leading indicators move first. Watch these:
New listings volume. A surge here flags supply pressure that hasn’t hit the inventory totals yet.
Pending sales. Pendings become closings 30 to 60 days out, so they hand you a preview of your sold numbers before those numbers print.
Showing activity and online listing views. The moment showings per listing slide, contracts soften right behind them.
Mortgage application volume. Purchase applications run ahead of closings by 30 to 90 days.
Price reductions. When a growing share of listings starts cutting price, that is one of the earliest tells that demand is thinning. It moves before days on market does.
Read leading indicators as a group. One can lie. Four moving together is a trend you can act on. When pending sales fall, price cuts rise, and showings drop in the same month, you tell your sellers to price sharply now, before the lagging numbers catch up and the whole market knows.
Real Estate Market Analysis Example
Let’s walk a real estate market analysis example all the way through. You are advising a seller in a single submarket. You pull one month of MLS data for the area, and here is what comes back:
- Active listings: 120
- New listings this month: 45
- Pending sales this month: 38
- Closed sales this month: 30
- Median sale-to-list ratio: 97%
- Median days on market: 41
- Share of listings with a price cut: 28%
Start with the inventory math. Months of inventory is 120 actives divided by 30 monthly sales, which gives you 4.0 months. On its face, that leans toward a seller’s market.
Absorption next. 30 closed against 120 active works out to a 25% monthly absorption rate. Healthy, not hot. And here is where the leading indicators flip the read.
- New listings (45) are outpacing both pendings (38) and closings (30), so supply is building faster than it clears.
- A 28% price-cut share is high.
- A 97% sale-to-list ratio means sellers are already handing back 3% at the table.
- Days on market at 41 is creeping up toward the balanced range.
Lagging picture: still a seller’s market at 4 months of inventory. Leading picture: cooling, and quickly.
New supply is rising, price cuts are spreading, and the gap between list and sale keeps widening. At that point the advice writes itself. Tell the seller to list now while inventory is still tight, and price at or just below the last few comps instead of chasing the top. Wait two months and they are likely looking at 5-plus months of inventory and a weaker hand at the table. That recommendation is built on numbers, and it is the kind of call that earns a client for life. This is exactly the analysis we build into client-facing reporting on our real estate marketing engagements, so the story behind a pricing decision is never a guess.
How to Present Findings to Clients
A brilliant analysis that confuses a client is a wasted analysis. Presentation is half the job.
Lead With the Recommendation
Open with the decision, not the data. “I recommend you list within the next three weeks and price at $X.” Then walk back through the numbers that got you there. Clients want the answer first and the evidence second.
Use Three Numbers, Not Thirty
Pick the three metrics that drive the decision and build the conversation around them. For a seller that is usually months of inventory, days on market, and the price-cut trend. Bury the rest in an appendix for the client who wants to see everything.
Show Trend, Not Snapshot
A single number invites argument. A six-month trend line ends it. Show months of inventory moving from 3.2 to 4.0 to 4.8 and the direction speaks for itself. Direction persuades better than any single figure.
Translate Into Dollars and Days
Clients think in money and time, not percentages. Do not say absorption fell 5 points. Say “homes like yours are taking about two weeks longer to sell than they did in spring, and that gap is widening.” Make the number land in their world. A clean, branded report does this work for you. When your analysis lives on a professional site with strong listing presentation, clients trust it more. Our real estate websites are built on our proprietary IDXBoost platform, which pulls live MLS data so the market story stays current without manual updates.
A Real Estate Market Analysis Template You Can Reuse
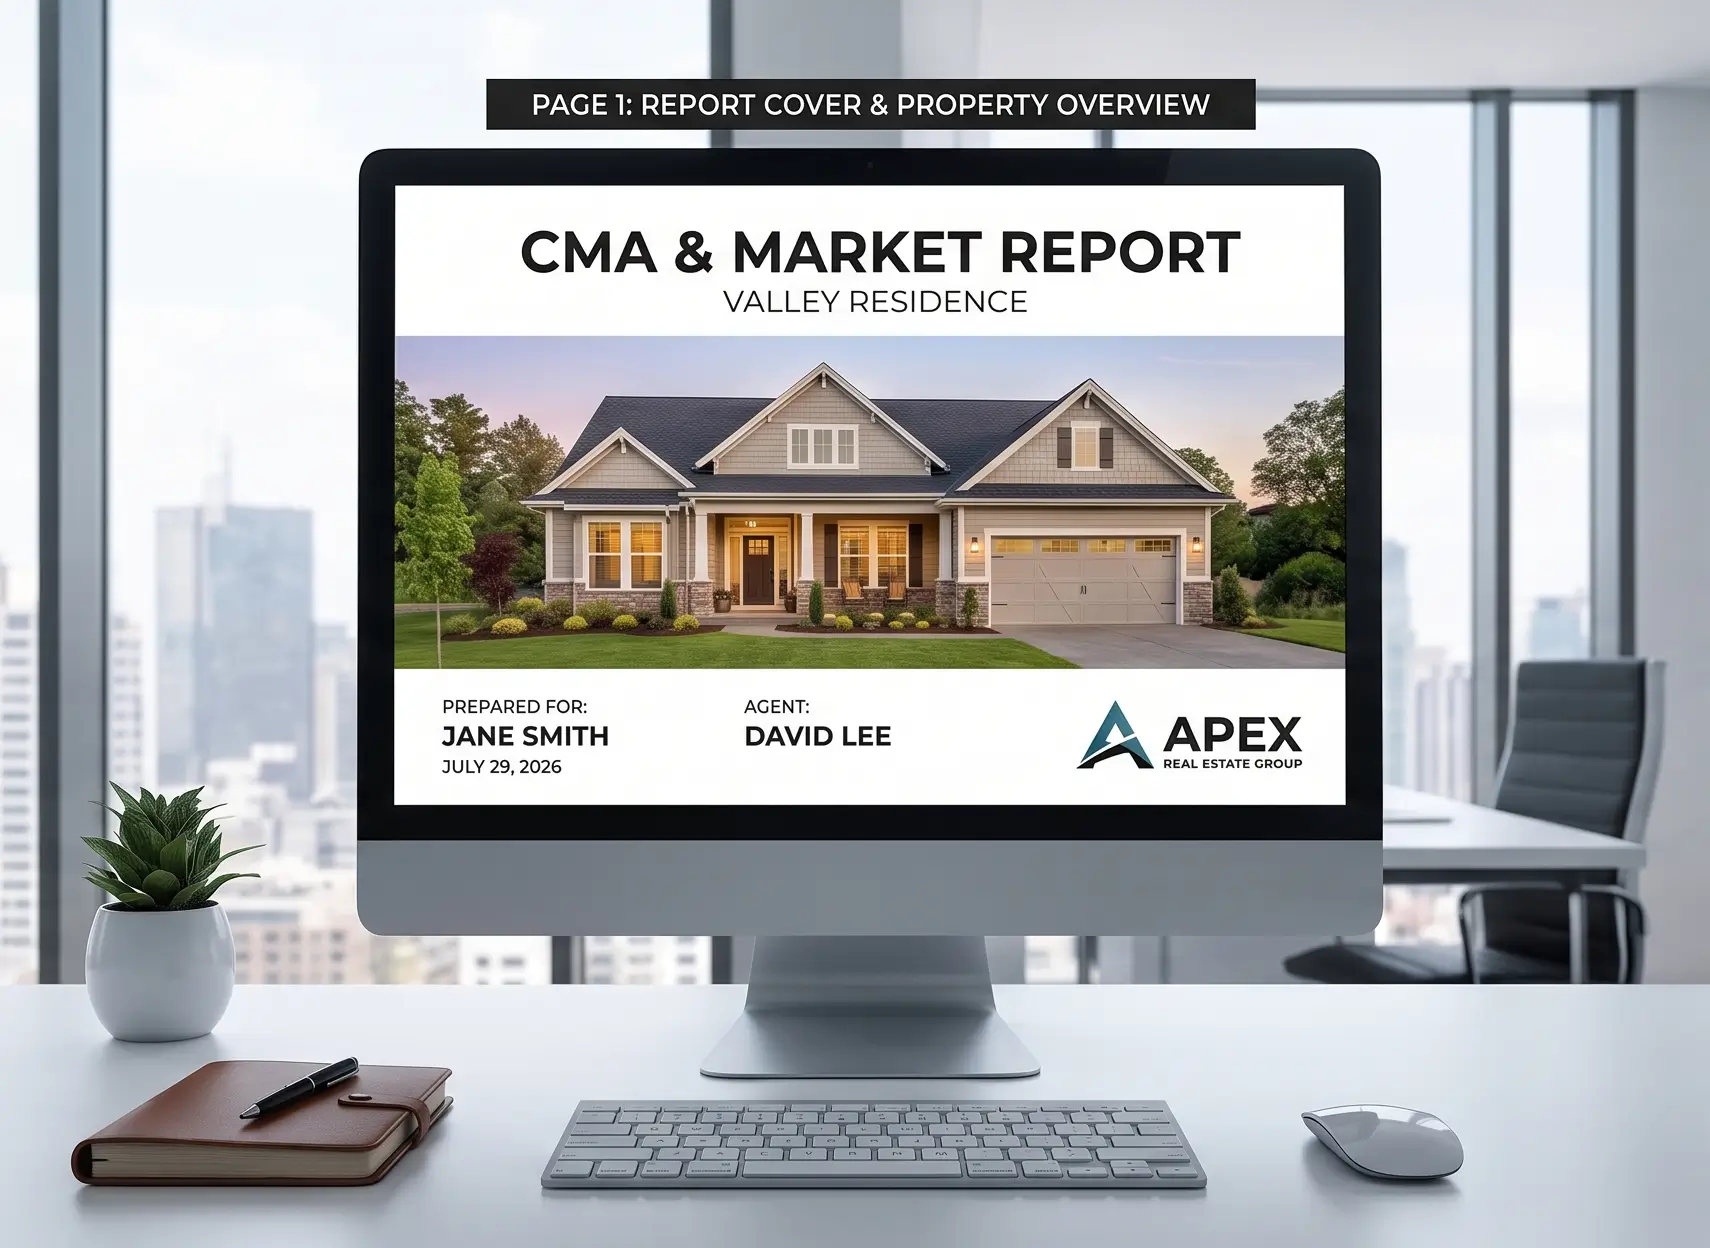
Quit rebuilding your analysis from scratch every single time. A standard real estate market analysis template makes you faster, keeps you consistent, and frankly makes you look like the professional you already are. Here is a structure that covers any market.
- Page 1: Executive Summary. One paragraph with your recommendation and the three numbers that support it. This is the only page some clients read, so make it carry the whole argument.
- Page 2: Market Overview. Metro-level context. Population and job growth, median price trend over 12 months, current months of inventory, and where rates sit. Sets the backdrop.
- Page 3: Neighborhood Detail. The same metrics at the local level, side by side with the metro figures so the gap is visible. This is the page that drives the decision.
- Page 4: Supply and Demand Dashboard. Active listings, new listings, pendings, closings, absorption rate, and months of inventory, each shown as a trend over six months rather than a single point.
- Page 5: Leading Indicators. Price-cut share, pending sales trend, days on market trend, and new listing volume. Label this page “what happens next” so the client understands these point forward.
- Page 6: Comparable Sales. Your closed comps, active competition, and expired listings, with adjustments shown. This is your pricing evidence.
- Page 7: Recommendation and Next Steps. Restate the call, give a price range or strategy, and lay out the timeline. End with a clear action.
Build this once. Fill it in for each market. Your analysis gets faster every time, and your clients get a consistent, professional document that justifies your advice and your commission. For more frameworks like this, see the rest of our agent resources on the blog.
Putting the Process to Work
A repeatable market analysis is one of the most valuable skills in this business, and now you have the full process. Pick a geography and time window. Pull MLS, public records, Census, and rate data at that level. Run supply and demand, build your CMA, and compare neighborhoods to metro. Separate the leading signals from the lagging ones. Then present three numbers, a trend, and a clear recommendation in a template you reuse every time. Do this consistently and you stop competing on personality and start competing on insight. That is a much harder thing for the agent down the street to copy.
Work With a Team That Lives in the Numbers
A strong market analysis wins listings, sets the right price, and builds the kind of trust that turns one client into a referral pipeline. The agents who do this well do not guess. They show their work. For more than a decade we have done exactly this work in real estate, supporting over $500M in development sales and building marketing engines for agents, brokers, and developers who measure results in closings. Our IDXBoost platform keeps live market data in front of your clients, and our team can build the reporting and presentation that makes your analysis impossible to argue with. If you want help turning market data into listings and closed deals, we should talk. Book a free consultation and we will show you what a measurable, ROI-focused marketing engine looks like for your market. Reach us at info@tremgroup.com.
Ready to Boost Your Sales?
We Know exactly what it takes to drive real results. Let’s craft a strategy that helps you close more deals and accelerate your growth. It’s time to make things happen.